Equity Long-Short Fund LP
Mandate:
Canadian Long Short Equity
Inception Date:
July 1, 2012
Fund Codes:
Closed to Purchases
Management Fees:
Class F 1%
Class G 2%
Performance Fee:
20%
Liquidity:
Monthly
The NewGen Equity Long-Short Fund LP is a opportunistic equity long/short strategy that seeks to capitalize on the considerable Alpha that is available in the structurally inefficient Canadian market. The Fund consistently maintains defensive market positioning to minimize the influence of market Beta on the Fund’s performance. It is a highly active management style that employs a disciplined adaptive risk management strategy to de-risk during periods of prolonged market volatility to preserve capital.
This Fund was offered to Canadian investors only, but it is currently closed to new subscriptions. US and other International investors are not eligible to invest.
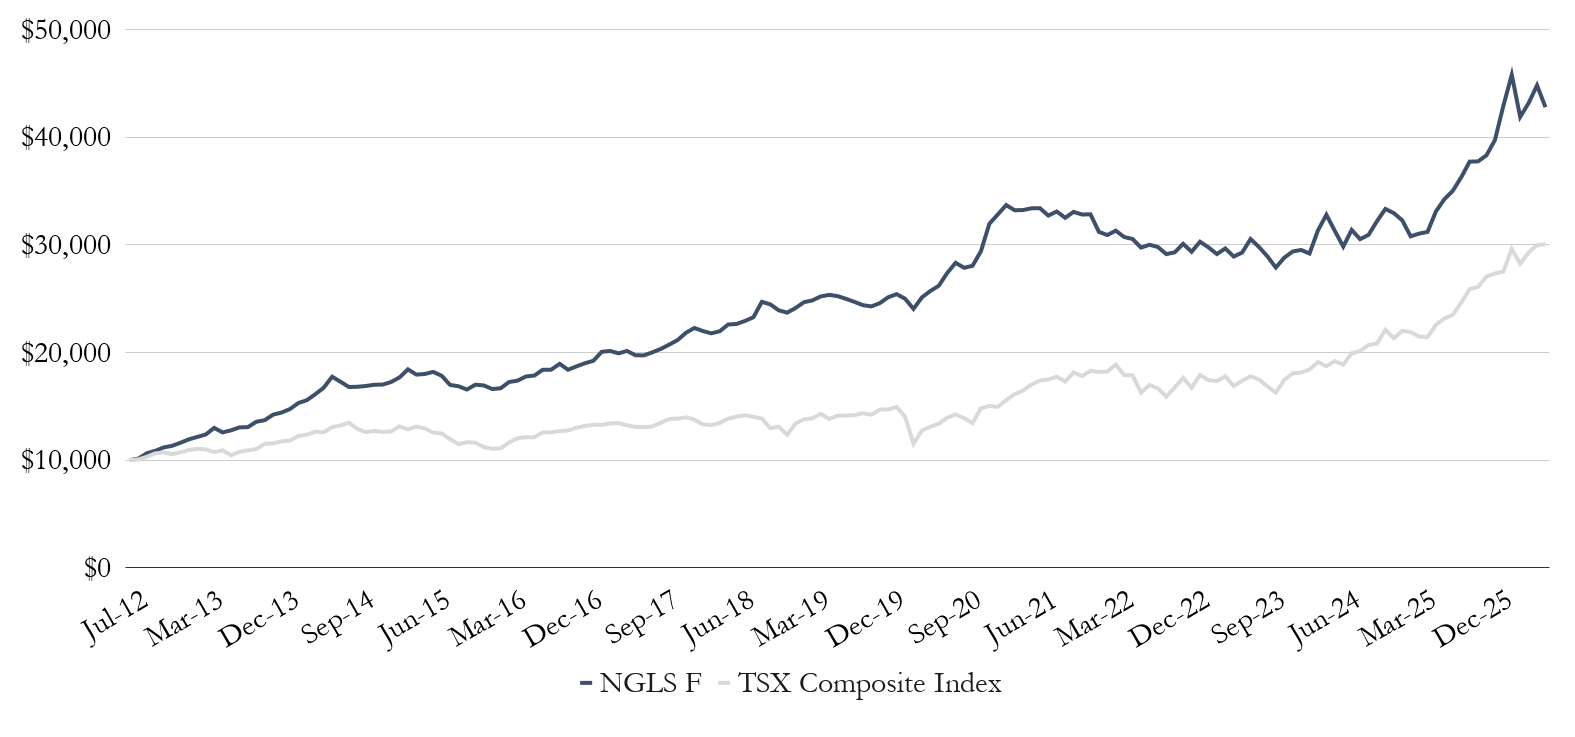
NewGen Equity Long-Short Fund LP: Growth of $10,000 Since Inception (Class F)
NewGen Equity Long-Short Fund LP (Class F)
| Jan | Feb | Mar | Apr | May | Jun | Jul | Aug | Sep | Oct | Nov | Dec | YTD | ||
| 2012 | NG ELS Class F | – | – | – | – | – | – | 1.33% | 4.94% | 2.12% | 2.93% | 1.32% | 2.52% | 16.10% |
| S&P/TSX | – | – | – | – | – | – | 0.59% | 2.44% | 3.08% | 0.86% | -1.48% | 1.59% | 7.22% | |
| 2013 | NG ELS Class F | 2.78% | 1.86% | 1.85% | 4.97% | -3.23% | 1.52% | 2.15% | 0.18% | 3.82% | 1.11% | 3.74% | 1.38% | 24.22% |
| S&P/TSX | 2.02% | 1.08% | -0.56% | -2.30% | 1.56% | -4.12% | 2.95% | 1.34% | 1.05% | 4.49% | 0.26% | 1.69% | 9.55% | |
| 2014 | NG ELS Class F | 2.24% | 3.81% | 1.71% | 3.55% | 3.78% | 6.09% | -2.65% | -2.82% | 0.14% | 0.44% | 0.66% | 0.10% | 18.01% |
| S&P/TSX | 0.54% | 3.76% | 0.88% | 2.21% | -0.33% | 3.71% | 1.22% | 1.92% | -4.26% | -2.32% | 0.90% | -0.76% | 7.42% | |
| 2015 | NG ELS Class F | 1.41% | 2.46% | 4.25% | -2.66% | 0.33% | 1.09% | -1.99% | -4.78% | -0.72% | -1.80% | 2.71% | -0.40% | -0.46% |
| S&P/TSX | 0.28% | 3.82% | -2.18% | 2.16% | -1.38% | -3.07% | -0.58% | -4.21% | -3.98% | 1.67% | -0.44% | -3.41% | -11.09% | |
| 2016 | NG ELS Class F | -1.97% | 0.42% | 3.50% | 0.72% | 2.25% | 0.46% | 3.03% | 0.04% | 2.96% | -2.90% | 1.71% | 1.53% | 12.16% |
| S&P/TSX | -1.44% | 0.30% | 4.93% | 3.39% | 0.82% | -0.01% | 3.68% | 0.10% | 0.88% | 0.42% | 2.00% | 1.36% | 17.51% | |
| 2017 | NG ELS Class F | 1.21% | 4.36% | 0.37% | -1.08% | 1.11% | -1.99% | -0.04% | 1.41% | 1.59% | 1.98% | 2.04% | 3.24% | 14.95% |
| S&P/TSX | 0.64% | 0.09% | 0.96% | 0.25% | -1.52% | -1.09% | -0.25% | 0.45% | 2.78% | 2.50% | 0.26% | 0.88% | 6.03% | |
| 2018 | NG ELS Class F | 2.01% | -1.28% | -0.96% | 0.89% | 2.86% | 0.22% | 1.24% | 1.50% | 6.15% | -0.95% | -2.27% | -0.91% | 8.53% |
| S&P/TSX | -1.59% | -3.19% | -0.49% | 1.57% | 2.91% | 1.35% | 0.96% | -1.04% | -1.17% | -6.51% | 1.13% | -5.76% | -11.64% | |
| 2019 | NG ELS Class F | 1.82% | 2.23% | 0.69% | 1.50% | 0.55% | -0.45% | -1.03% | -1.12% | -1.22% | -0.47% | 1.25% | 2.23% | 6.04% |
| S&P/TSX | 8.50% | 2.95% | 0.64% | 2.97% | -3.28% | 2.15% | 0.15% | 0.22% | 1.32% | -1.05% | 3.38% | 0.14% | 19.13% | |
| 2020 | NG ELS Class F | 1.14% | -1.67% | -3.77% | 4.46% | 2.34% | 1.90% | 4.53% | 3.45% | -1.64% | 0.65% | 4.83% | 8.68% | 27.16% |
| S&P/TSX | 1.49% | -6.09% | -17.74% | 10.48% | 2.79% | 2.12% | 4.22% | 2.14% | -2.38% | -3.35% | 10.33% | 1.41% | 2.17% | |
| 2021 | NG ELS Class F | 2.71% | 2.66% | -1.43% | 0.07% | 0.48% | 0.04% | -2.06% | 1.16% | -1.77% | 1.69% | -0.74% | 0.06% | 2.76% |
| S&P/TSX | -0.55% | 4.17% | 3.55% | 2.18% | 3.26% | 2.20% | 0.61% | 1.45% | -2.49% | 4.82% | -1.79% | 2.72% | 21.74% | |
| 2022 | NG ELS Class F | -4.96% | -0.96% | 1.32% | -1.89% | -0.60% | -2.62% | 0.90% | -0.69% | -2.22% | 0.57% | 2.69% | -2.57% | -10.71% |
| S&P/TSX | -0.59% | 0.13% | 3.62% | -5.15% | -0.16% | -9.01% | 4.41% | -1.84% | -4.59% | 5.32% | 5.29% | -5.22% | -8.66% | |
| 2023 | NG ELS Class F | 3.19% | -1.72% | -2.10% | 1.78% | -2.52% | 1.26% | 4.30% | -2.41% | -2.93% | -3.58% | 3.27% | 2.15% | 0.23% |
| S&P/TSX | 7.13% | -2.63% | -0.60% | 2.67% | -5.16% | 2.98% | 2.34% | -1.62% | -3.70% | -3.42% | 7.22% | 3.57% | 8.12% | |
| 2024 | NG ELS Class F | 0.48% | -1.13% | 7.39% | 4.60% | -4.56% | -4.66% | 5.21% | -2.73% | 1.30% | 4.11% | 3.53% | -1.16 | 12.14% |
| S&P/TSX | 0.30% | 1.63% | 3.76% | -2.04% | 2.55% | -1.77% | 5.65% | 1.02% | 2.80% | 0.65% | 6.17% | -3.59% | 17.99% | |
| 2025 | NG ELS Class F | -2.03% | -4.62% | 0.83% | 0.51% | 6.11% | 3.41% | 2.28% | 3.59% | 4.01% | 0.06% | 1.50% | 3.68% | 20.58% |
| S&P/TSX | 3.26% | -0.55% | -1.87% | -0.30% | 5.37% | 2.61% | 1.50% | 4.79% | 5.11% | 0.79% | 3.71% | 1.05% | 28.24% | |
| 2026 | NG ELS Class F | 8.00% | 6.74% | -8.56% | 3.09% | 3.81% | -4.54% | 7.69% | ||||||
| S&P/TSX | 0.67% | 7.57% | -4.58% | 3.65% | 2.37% | 0.25% | 9.92% |
| 1-MTH | YTD | 1-YR | 3-YR | 5-YR | 10-YR | INCEPTION |
|---|---|---|---|---|---|---|
| -4.54% | 7.69% | 25.0% | 13.5% | 5.1% | 9.1% | 10.9% |
Performance data is since strategy inception (July 2012) and reported net of all fees; data prior to February 1, 2014 is for Class A – Series 1 Units (adjusted to a 1% management fee) from the NewGen Equity Long/Short Fund, an Exempted Company incorporated in the Cayman Islands; effective February 1, 2013 this Fund changed its base currency from USD to CAD, presentation of performance data prior to this date assumes USD hedged to CAD; the NewGen Equity Long-Short Fund LP adopted an identical investment strategy on February 1, 2014; data on and after February 1, 2014 is for Class F – Series 1 Units of the NewGen Equity Long-Short Fund LP
The TSX Composite Index and TSX Smallcap Index comparative performance is provided for illustrative purposes only – they are widely followed indices but are not considered benchmarks due to differing holding composition compared to the NewGen Equity Long-Short Fund LP. The composition of the Funds’ portfolio could differ significantly from these indices due to the investment strategy employed, and includes differences such as use of short positions, varying fund net exposure, varying sector exposure, and investing in small and mid
capitalization stocks. Please see “Investment Strategies” in the Confidential Offering Memorandum for more details.
Jensen’s Alpha is a hypothetical measures of excess return (a risk-free rate of 1.5% is assumed)